Network problems are the most misdiagnosed failures in production systems. When applications slow down, engineers often look first at CPU, memory, or disk. Networks are treated as unreliable by nature and, therefore, difficult to reason about. As a result, network issues are frequently identified late, after other explanations have been exhausted.
This is a mistake.
Modern distributed systems are defined by the network. Every request, dependency, retry, and failure crosses it. Network monitoring is not about counting packets. It is about understanding latency, loss, and dependency behavior across systems.
Why Network Monitoring Feels Harder Than It Is
Networks behave differently from other resources. CPU and disk failures tend to be local and deterministic. Network behavior is probabilistic. Latency fluctuates. Paths change. Congestion appears transiently. Failures are partial rather than absolute.
This variability causes teams to distrust network metrics. Instead of building better visibility, they ignore signals that are actually highly predictive of user impact. Effective network monitoring embraces variability rather than fighting it.
Latency as the Primary Network Signal
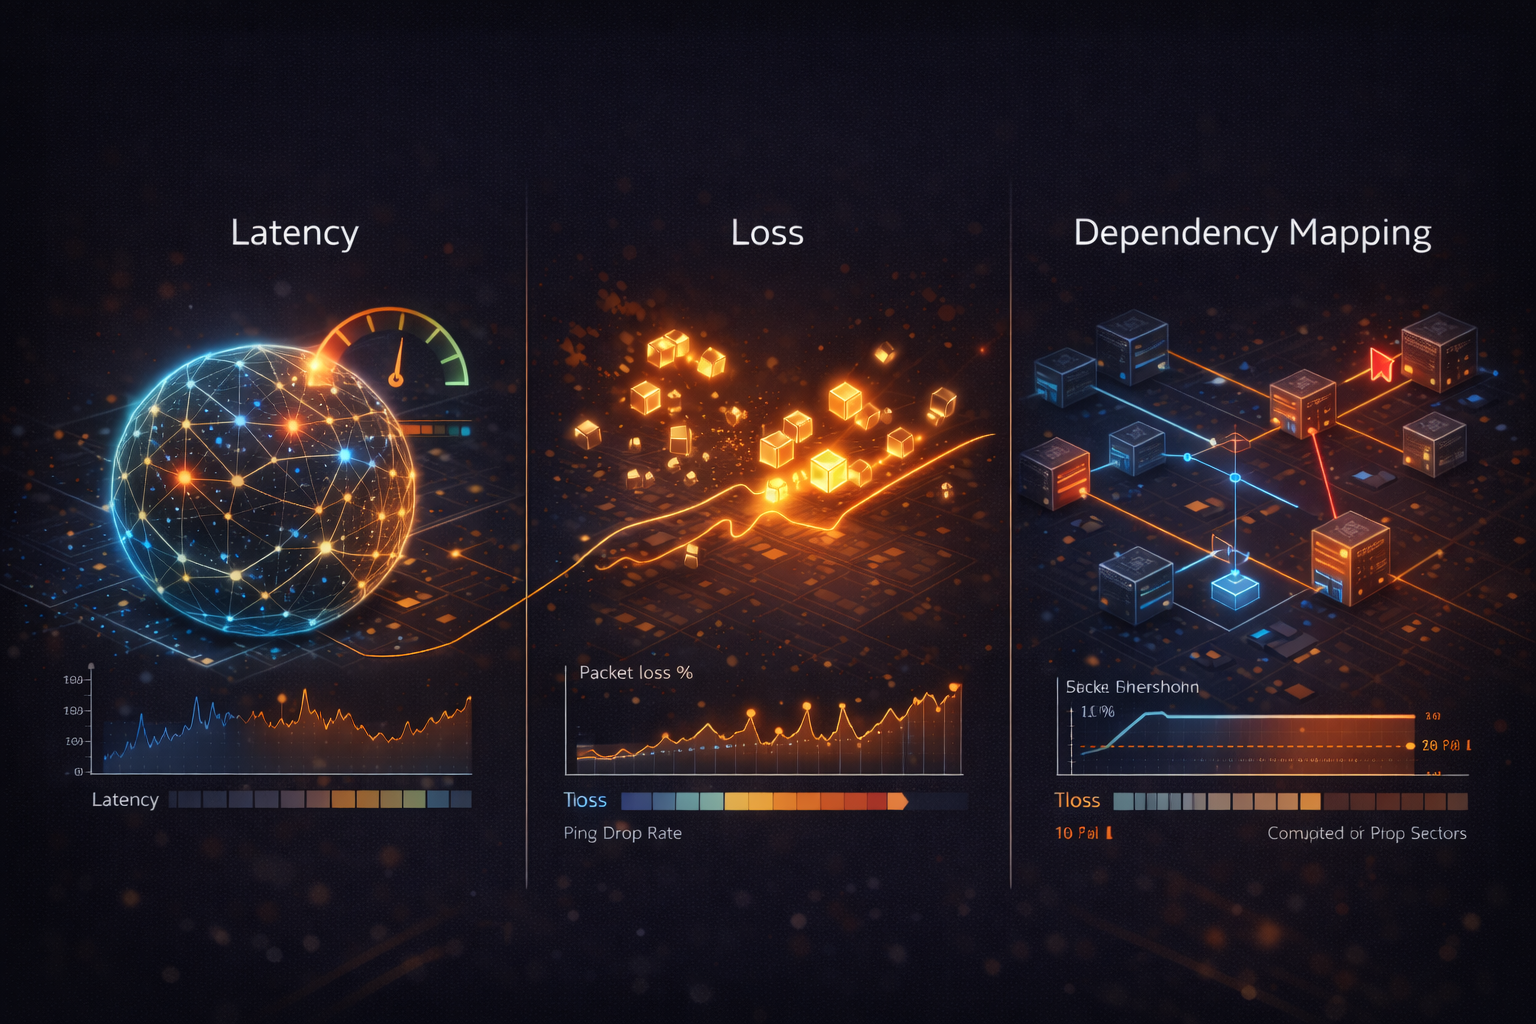
Latency is the most important network metric. Latency measures how long it takes for data to travel between two points. In distributed systems, this directly affects response time, retry behavior, and cascading failures.
Average latency is rarely useful. Tail latency is where problems surface first. Small increases at the high end of the distribution often explain timeouts, retries, and degraded user experience, even when averages appear stable. Network latency matters because it compounds. A few milliseconds added at each hop quickly becomes visible at the application level.
Packet Loss and Its Hidden Cost
Packet loss is often treated as a binary problem. Either packets are lost, or they are not. In reality, low levels of packet loss can be devastating. Modern protocols retransmit lost packets. This masks loss at the transport layer but increases latency and jitter. Applications experience slow responses rather than outright failure.
Even fractional loss can trigger retry storms, amplify congestion, and destabilize systems under load. Monitoring packet loss trends is essential, especially between critical dependencies.
Jitter and Variability
Jitter describes variation in latency over time. High jitter means latency is unpredictable. This breaks assumptions in timeout logic, connection pooling, and retry strategies. Systems that tolerate steady latency often fail under variable latency.
Jitter rarely triggers alerts directly. It shows up indirectly as inconsistent performance, intermittent timeouts, and flaky behavior that is difficult to reproduce. Network monitoring that includes variability metrics reveals problems that static thresholds miss.
Throughput in Context
Throughput measures how much data is transferred over time. High throughput is not inherently good or bad. It must be interpreted alongside latency and loss. High throughput with rising latency suggests congestion. Low throughput with low latency may indicate underutilization or upstream bottlenecks.
Throughput alone does not explain network health. It explains demand.
Network Errors and Retransmissions
Network errors rarely appear as clean failures. Retransmissions, connection resets, and handshake failures often occur silently beneath the application layer. Systems continue to function, but performance degrades.
Monitoring retransmission rates and connection errors provides insight into network instability that application metrics cannot explain. These signals often precede visible outages.
Dependency Mapping: The Missing Layer
The most important aspect of network monitoring is understanding who depends on whom. In modern systems, services rarely communicate directly with users alone. They depend on databases, caches, message queues, third-party APIs, and internal services. Every dependency introduces a network path.
Without dependency mapping, network metrics lack context. Latency increases somewhere, but it is unclear which service relationship is affected. Dependency mapping turns raw network signals into actionable insight by showing:
- Which services communicate
- How often
- Over which paths
- With what performance characteristics
This is where network monitoring becomes operationally useful.
Cross-Zone and Cross-Region Effects
Cloud environments introduce additional complexity. Traffic crossing availability zones or regions behaves differently from local traffic. Latency increases. Failure modes change. Partial outages become common.
Monitoring that does not distinguish between local and remote network paths hides this reality. Teams see performance issues without understanding that traffic patterns changed. Effective network monitoring must reflect topology, not just traffic volume.
Network Monitoring During Incidents
During incidents, network metrics answer critical questions:
- Is latency increasing between specific services
- Is packet loss triggering retries
- Are failures localized or systemic
- Is the network amplifying another bottleneck
Network monitoring prevents teams from chasing symptoms in compute or storage when the root cause lies in connectivity.
Why Network Issues Cause Cascading Failures
Network degradation rarely affects only one component. Increased latency triggers retries. Retries increase load. Increased load amplifies contention elsewhere. Systems that are individually healthy collapse collectively.
This cascading behavior is why network monitoring must be proactive. By the time applications fail loudly, the network problem has often existed for some time.
Network Monitoring as a Reliability Discipline
Network monitoring is not optional in distributed systems. It is foundational. Understanding latency, loss, and dependencies turns the network from an opaque risk into a measurable system component. It enables faster diagnosis, calmer incident response, and more resilient architectures.