Disk I/O problems are among the hardest production issues to diagnose. They rarely announce themselves loudly. Systems usually keep running. CPU appears idle. Memory looks stable. Yet applications slow down, timeouts increase, and user experience degrades.
This is because disk issues tend to fail silently.
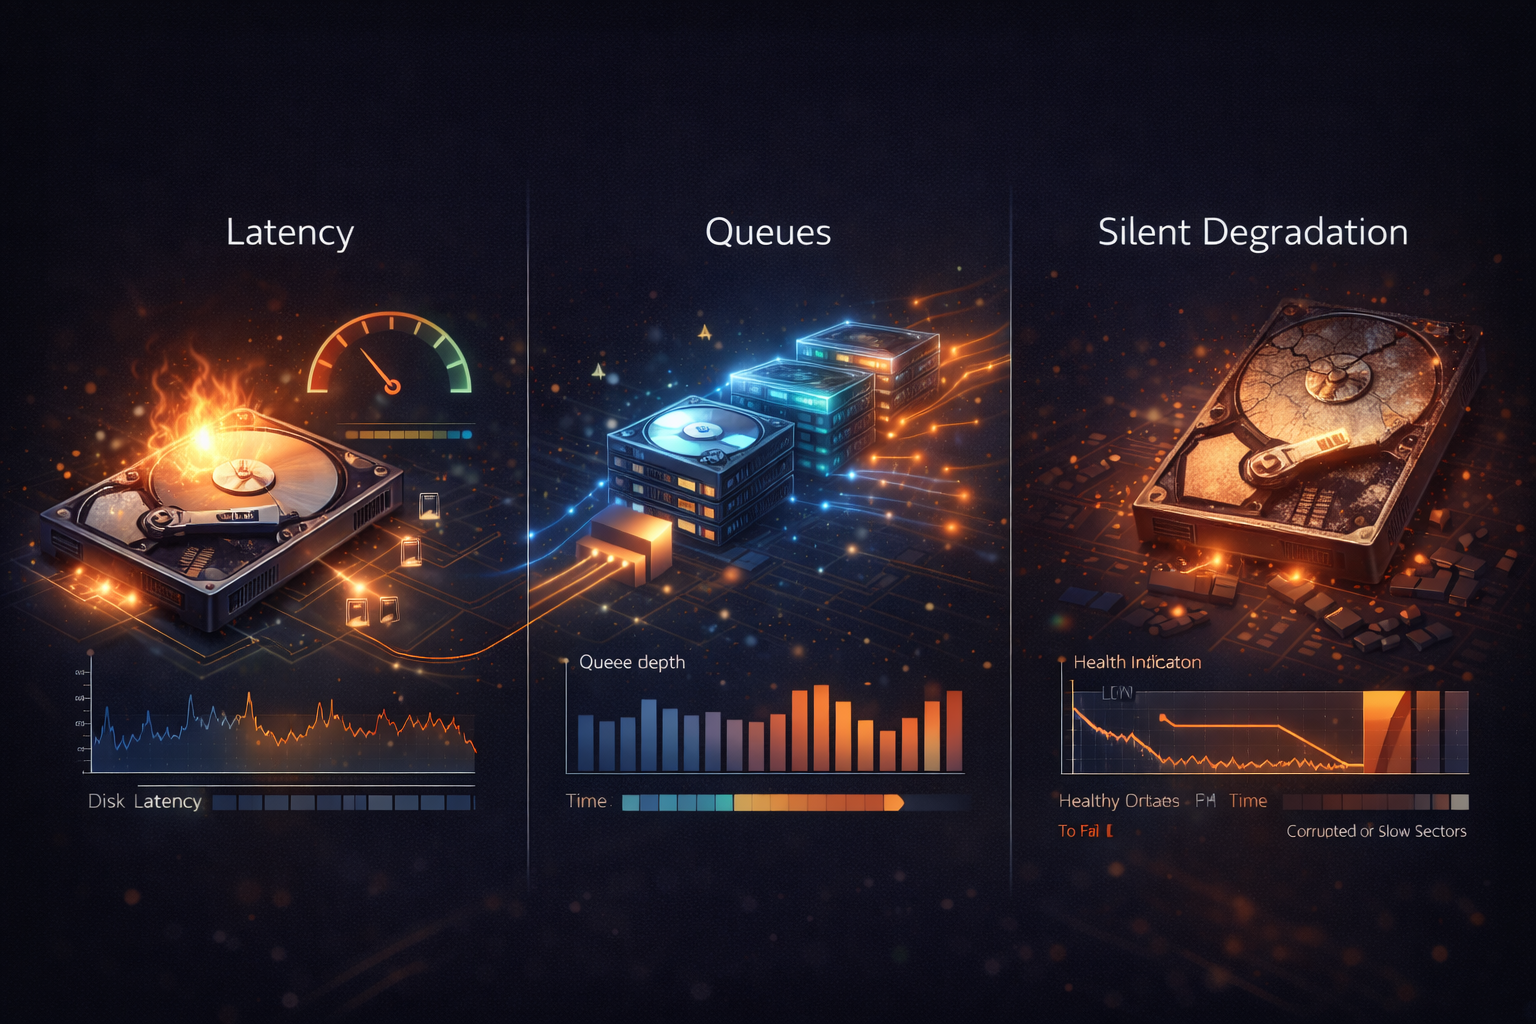
Unlike CPU saturation or memory exhaustion, disk I/O degradation often manifests as increased waiting rather than outright failure. Monitoring disk usage alone does not reveal this. Understanding disk I/O requires focusing on latency, queues, and contention, not just capacity.
Why Disk Monitoring Is Often Misleading
Many teams equate disk monitoring with free space checks. While running out of disk space is dangerous, it is usually not the first problem to appear.
Disk subsystems fail gradually:
- Latency increases
- Queues build up
- Applications block waiting for I/O
- Throughput plateaus or declines
By the time space becomes an issue, performance has often been degraded for a long time. Disk monitoring must focus on how fast the system can service I/O requests, not how much space remains.
Disk Latency as the Primary Signal
Latency is the most important disk metric. Disk latency measures how long it takes for a read or write request to be completed. Even small increases can have an outsized impact, especially on databases and synchronous workloads.
Low utilization with high latency is a common and dangerous pattern. It usually indicates contention, throttling, or underlying storage problems rather than a lack of capacity. In production systems, rising disk latency almost always precedes visible failures.
Read vs Write Latency
Not all I/O is equal. Read latency affects request handling, query execution, and cache misses. Write latency affects durability, logging, and transactional guarantees.
Some systems tolerate slower writes but fail quickly under slow reads. Others exhibit the opposite behavior. Effective disk monitoring separates read and write latency to understand which operations are impacted and why.
I/O Queues and Waiting Time
When disks cannot keep up with demand, requests queue. Queue depth indicates how many I/O operations are waiting to be processed. A growing queue means the storage layer is overloaded or stalled.
This is often invisible at the application layer. Applications simply block. CPU becomes idle. Latency increases elsewhere. Queue buildup is one of the clearest indicators of disk contention and one of the most overlooked metrics.
I/O Wait and CPU Misinterpretation
Disk problems frequently appear as CPU issues. When processes block waiting for disk I/O, the CPU spends time waiting. This shows up as I/O wait rather than user or system time.
Teams unfamiliar with this pattern may assume CPU is underutilized or misconfigured. In reality, the CPU is idle because it has nothing to execute while waiting for disk responses. Disk I/O wait is a strong signal that storage is limiting throughput.
Throughput and Saturation
Disk throughput describes how much data is read or written per second. High throughput is not inherently bad. Sustained throughput at or near device limits, combined with rising latency, indicates saturation.
Low throughput with high latency often indicates contention or throttling rather than load. Throughput must always be interpreted alongside latency and queue depth. None of these metrics are meaningful in isolation.
Random vs Sequential I/O
Disk behavior changes dramatically based on access patterns. Sequential I/O is efficient and predictable. Random I/O introduces seek overhead and contention, especially on spinning disks.
Modern SSDs mitigate this but do not eliminate the problem entirely, especially under mixed workloads. Monitoring that does not distinguish between random and sequential patterns misses critical performance characteristics.
Disk Contention and Shared Storage
In virtualized and cloud environments, disks are often shared. Multiple workloads compete for the same underlying storage. One noisy neighbor can degrade performance for others without obvious signals.
This results in unpredictable latency spikes that are difficult to attribute without proper disk monitoring. Shared storage environments require latency and queue monitoring even when capacity and throughput appear acceptable.
Filesystem and Application Effects
Disk behavior is influenced by more than hardware. Filesystem choices, mount options, journaling behavior, and application access patterns all affect I/O performance.
Write amplification, synchronous writes, and metadata-heavy operations can degrade performance unexpectedly. Disk monitoring provides the evidence needed to distinguish between hardware limitations and software-induced contention.
Silent Degradation in Production
Disk issues often escape detection because they do not trigger obvious alerts. Applications slow down gradually. Retries increase. Timeouts creep in. Teams respond by scaling CPU or memory, masking the real issue temporarily.
This is why disk monitoring must be proactive. Latency trends, queue growth, and waiting time reveal problems long before systems fail outright.
Disk Metrics During Incident Response
During incidents, disk metrics help answer critical questions:
- Are requests blocked on storage
- Is latency rising without increased throughput
- Is contention coming from inside or outside the system
- Is scaling compute likely to help or hurt
Disk monitoring prevents wasted effort and misdirected fixes.
Disk metrics rarely determine user impact directly. They explain why impact occurs. Disk monitoring should support service-level signals, not replace them. When used correctly, it provides clarity during incidents and confidence during growth.