Memory monitoring is one of the most misunderstood areas of system observability. Many teams focus on memory usage alone, treating it as a static resource that should remain mostly free. Modern operating systems work very differently.
In production systems, high memory usage is often healthy. Low free memory is not inherently a problem. What matters is whether the system is under memory pressure and how it behaves when demand changes. Understanding memory monitoring requires shifting from a usage mindset to a pressure and stability mindset.
What Memory Is Actually Used For
Memory exists to reduce work. Operating systems aggressively use available memory to cache data, buffer I/O, and speed up execution. Unused memory provides no benefit. As a result, modern systems intentionally keep free memory low.
This design choice often confuses operators who equate low free memory with risk. In reality, a system with large caches and low free memory can be perfectly healthy and highly performant. Memory monitoring must start with an understanding that usage alone is not a failure signal.
Free Memory Is Not the Goal
Free memory represents memory that is not currently allocated or cached. A system with large amounts of free memory may be underutilized or lightly loaded. A system with very little free memory may simply be efficient.
Free memory becomes relevant only when the system cannot reclaim memory fast enough to satisfy new allocation requests. At that point, pressure appears. Monitoring free memory in isolation produces false alarms and unnecessary intervention.
Cached and Buffered Memory
A large portion of memory in production systems is used for caching. Page cache stores recently accessed file data. Buffer cache holds metadata and I/O buffers. These caches dramatically reduce disk access and improve performance.
Cached memory does not lose capacity. It is immediately reclaimable when applications need it. This is why systems report large cache usage alongside low free memory. Effective memory monitoring treats cached memory as a performance asset, not a liability.
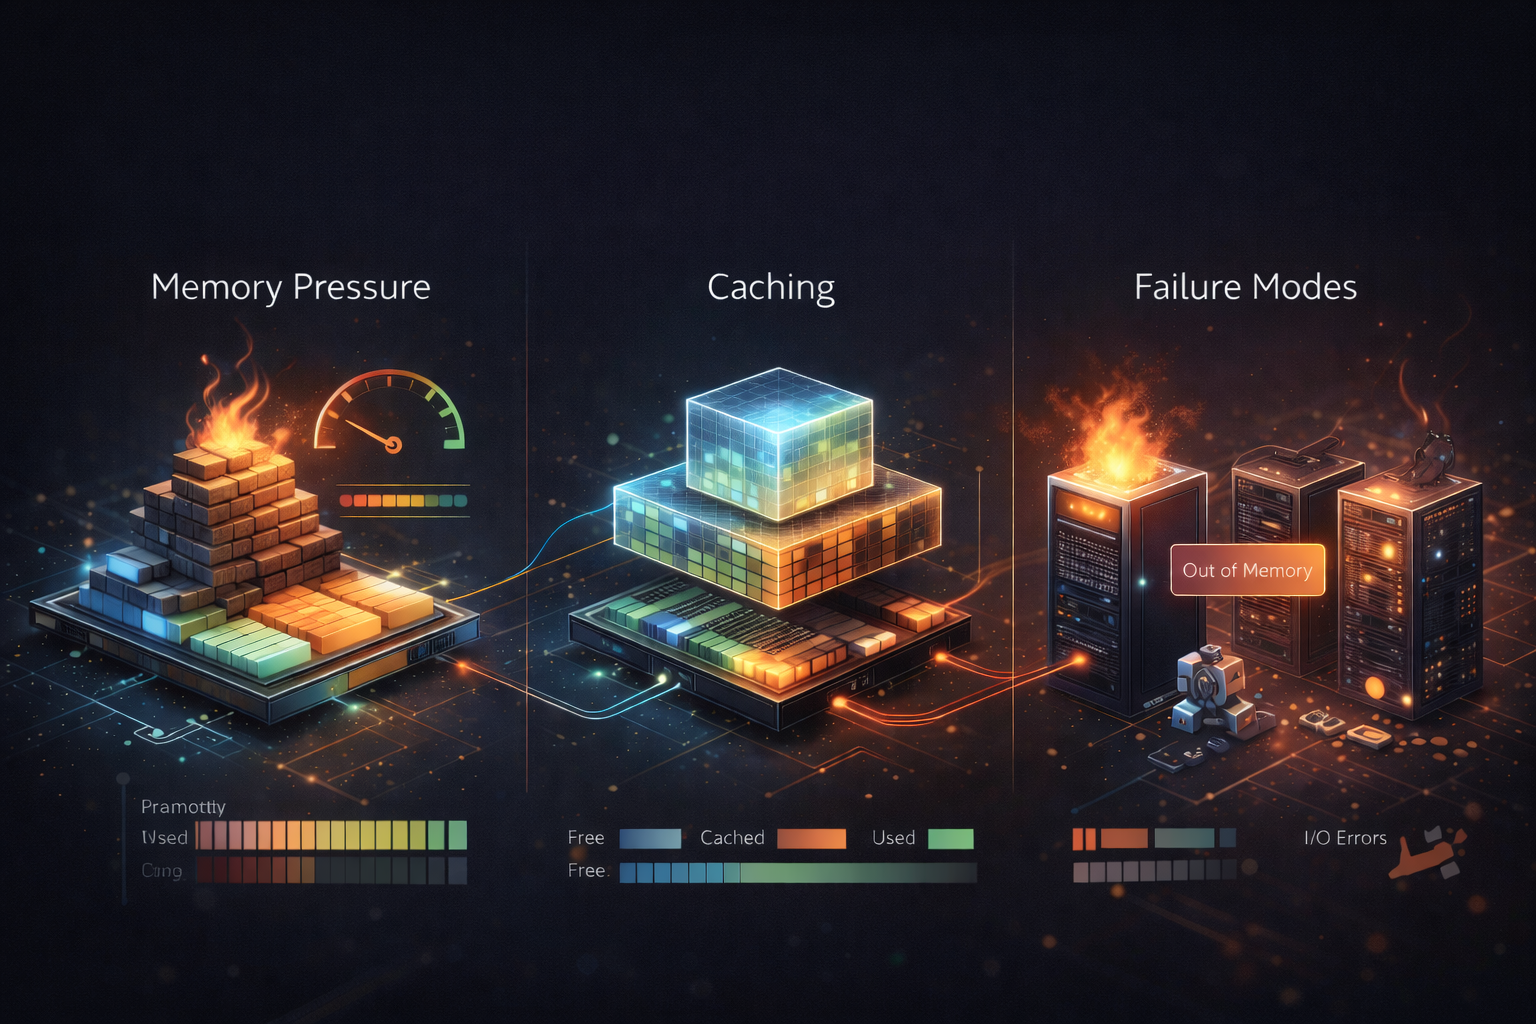
Memory Pressure as the Core Signal
Memory pressure describes how hard the system must work to satisfy memory allocation requests. When memory pressure increases, the operating system spends more time reclaiming memory, evicting cache pages, and managing allocations. This activity consumes CPU time and introduces latency long before applications fail outright.
Key symptoms of memory pressure include:
- Increased reclaim activity
- Growing allocation latency
- Background tasks are slowing down
- Intermittent performance degradation
Pressure is the signal that matters, not absolute usage.
Swap Activity and What It Really Means
Swap usage is often treated as an emergency indicator. In practice, its meaning depends on behavior, not presence. Occasional swap usage can be normal. Inactive pages may be swapped out to make room for active memory without impacting performance.
Problems arise when swap activity becomes frequent or continuous. This indicates the system is struggling to keep active working sets in memory. Performance degrades as pages are repeatedly evicted and reloaded. Monitoring swap trends over time is far more valuable than alerting on swap usage alone.
Major vs Minor Page Faults
Page faults occur when a process accesses memory that is not currently mapped. Minor page faults are common and inexpensive. They usually involve mapping memory already resident in RAM. Major page faults require disk access. They are slow and disruptive.
A rise in major page faults is a strong indicator of memory pressure impacting application performance. This signal often appears before swap usage becomes obvious. Memory monitoring that includes fault rates provides early warning of trouble.
Memory Fragmentation and Allocation Failures
Memory is not a single contiguous pool. Fragmentation can prevent large allocations even when total free memory appears sufficient. Fragmentation issues are subtle and often missed by basic monitoring. They tend to surface in long-running systems with varied allocation patterns.
When fragmentation becomes severe, allocation latency increases and failures occur unexpectedly. Monitoring allocation behavior and failure counts is critical in memory-intensive workloads.
The Out-of-Memory Killer
When memory pressure becomes unsustainable, the operating system may invoke the out-of-memory killer. This mechanism terminates processes to free memory and restore stability. From the system’s perspective, this is recovery. From the application’s perspective, it is a crash.
OOM events are not sudden. They are the final stage of prolonged memory pressure. Proper monitoring surfaces warning signs long before this point. Memory monitoring should aim to prevent OOM situations rather than react to them.
Containers and Memory Limits
In containerized environments, memory monitoring becomes more complex. Containers may have explicit memory limits. When those limits are reached, the kernel enforces them regardless of host-level availability. This can trigger memory pressure or OOM behavior inside the container even when the host has ample free memory.
Effective memory monitoring must consider both container-level and host-level signals to avoid misleading conclusions.
Memory Metrics in Incident Response
During incidents, memory metrics help answer specific questions:
- Is performance degradation caused by pressure or allocation churn
- Is cache eviction impacting latency
- Is swap activity amplifying response times
- Is the system approaching an OOM condition
Memory metrics explain slowdowns that CPU and disk metrics cannot.
Why Memory Monitoring Is About Trends, Not Thresholds
Static thresholds fail for memory monitoring. Healthy systems change over time. Working sets grow and shrink. Cache behavior adapts. What matters is whether the system remains stable under load. Trend analysis reveals whether pressure is increasing, whether reclaim costs are rising, and whether performance degradation correlates with memory behavior. Memory monitoring rewards patience and context more than any other resource.
Many production failures blamed on CPU or disk are rooted in memory behavior. Without proper memory monitoring, teams misdiagnose incidents and apply ineffective fixes. Understanding memory pressure, caching, and allocation behavior turns memory from a source of mystery into a predictable, manageable resource.