Project Background
A leading company in the network security space required a robust visualization platform for its ClickHouse-based NetFlow data. Client’s objectives were:
- Enable their customers to analyze traffic metrics through interactive dashboards,
- Enforce strict data segregation, maintain operational ease for internal teams,
- and present all of this under their own brand identity.
The project called for deploying a Secure Multi-Tenant NetFlow Analytics Platform with a Grafana environment, integrating it with the client’s ClickHouse cluster, implementing advanced data access controls, and delivering powerful self-service analytics and alerting capabilities.
Solution Architecture & Technical Challenges
1. Multi-Tenant Grafana Environment Integrated with ClickHouse
A dedicated Grafana server was deployed on the client’s infrastructure, configured with HTTPS/TLS using client-provided certificates. Grafana’s organizational model was leveraged to create logical boundaries, where:
- Each tenant (customer) was provisioned as a separate Grafana organization.
- Each organization had its own dashboards, users, and an isolated ClickHouse data source.
The integration used the official ClickHouse plugin. The critical challenge was ensuring users only saw data belonging to them. This was addressed by implementing ClickHouse’s row-level and column-level security policies, which transparently restricted data queries at the database layer.
2. Comprehensive Data Governance
To guarantee that data was only accessible by authorized tenants:
- ClickHouse
row_policyandcolumn_policyMechanisms were configured for each organization. - Grafana datasources were set up with credentials tied to these database policies, ensuring that even if queries were modified in dashboards or in the Explore view, tenants could never access data beyond their assigned tables.
Automation & Custom Tooling
Given the scale and need for operational efficiency, the project included extensive automation developed by BlueGrid.io. This comprised three core components:
1. Automated Organization and User Provisioning
A setup suite was created to:
- Instantiate a new Grafana organization.
- Configure a dedicated ClickHouse datasource scoped to that organization.
- Create an admin user with synchronized credentials (matching ClickHouse for operational simplicity).
- Deploy a default NetFlow analytics dashboard tied to the new datasource.
- Clone predefined alert rules into a fresh alert folder and configure email contact points.
This allowed onboarding new tenants in minutes with a single command, avoiding manual admin panel steps and ensuring consistency across environments.
2. Fleet Dashboard Management
Custom tooling was delivered to maintain dashboards across all tenant organizations:
- New or updated dashboards could be cloned from a central template and automatically applied to all organizations, preserving individual data source configurations.
- This ensured that visualizations remained uniform across all tenants while still enforcing their data access constraints.
This dramatically simplified operations for the client’s technical team, reducing repetitive manual work.
3. Automated Branding Post-Upgrade
Since Grafana OSS does not support built-in white-labeling, a dedicated branding patch utility was built. It:
- Automatically replaced default titles, logos, and static assets with client-provided branding.
- Patched version-specific JavaScript build files and static HTML templates.
- It was designed to be re-run after every Grafana upgrade to instantly restore branding.
A dry-run feature allowed safe validation before applying changes, preventing unexpected UI regressions.
Delivered User Experience
For End Users (Tenants)
- Dedicated login: Each organization received its own admin account and credentials.
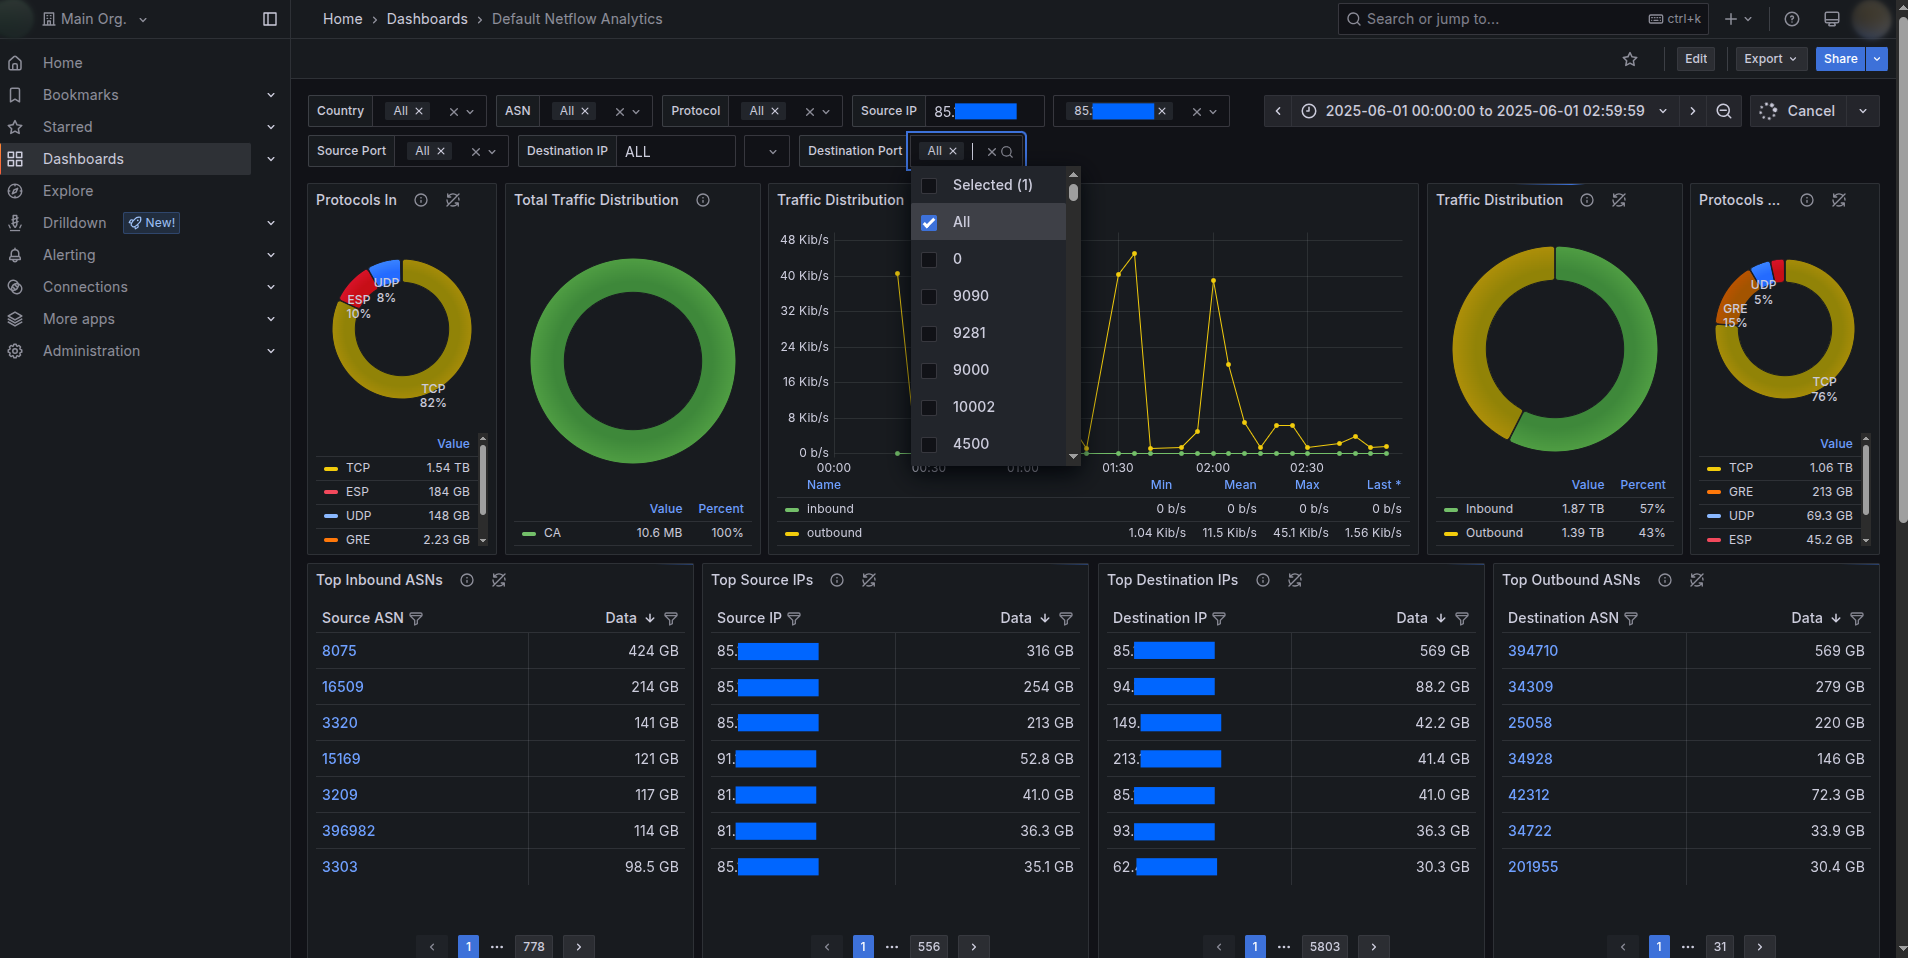
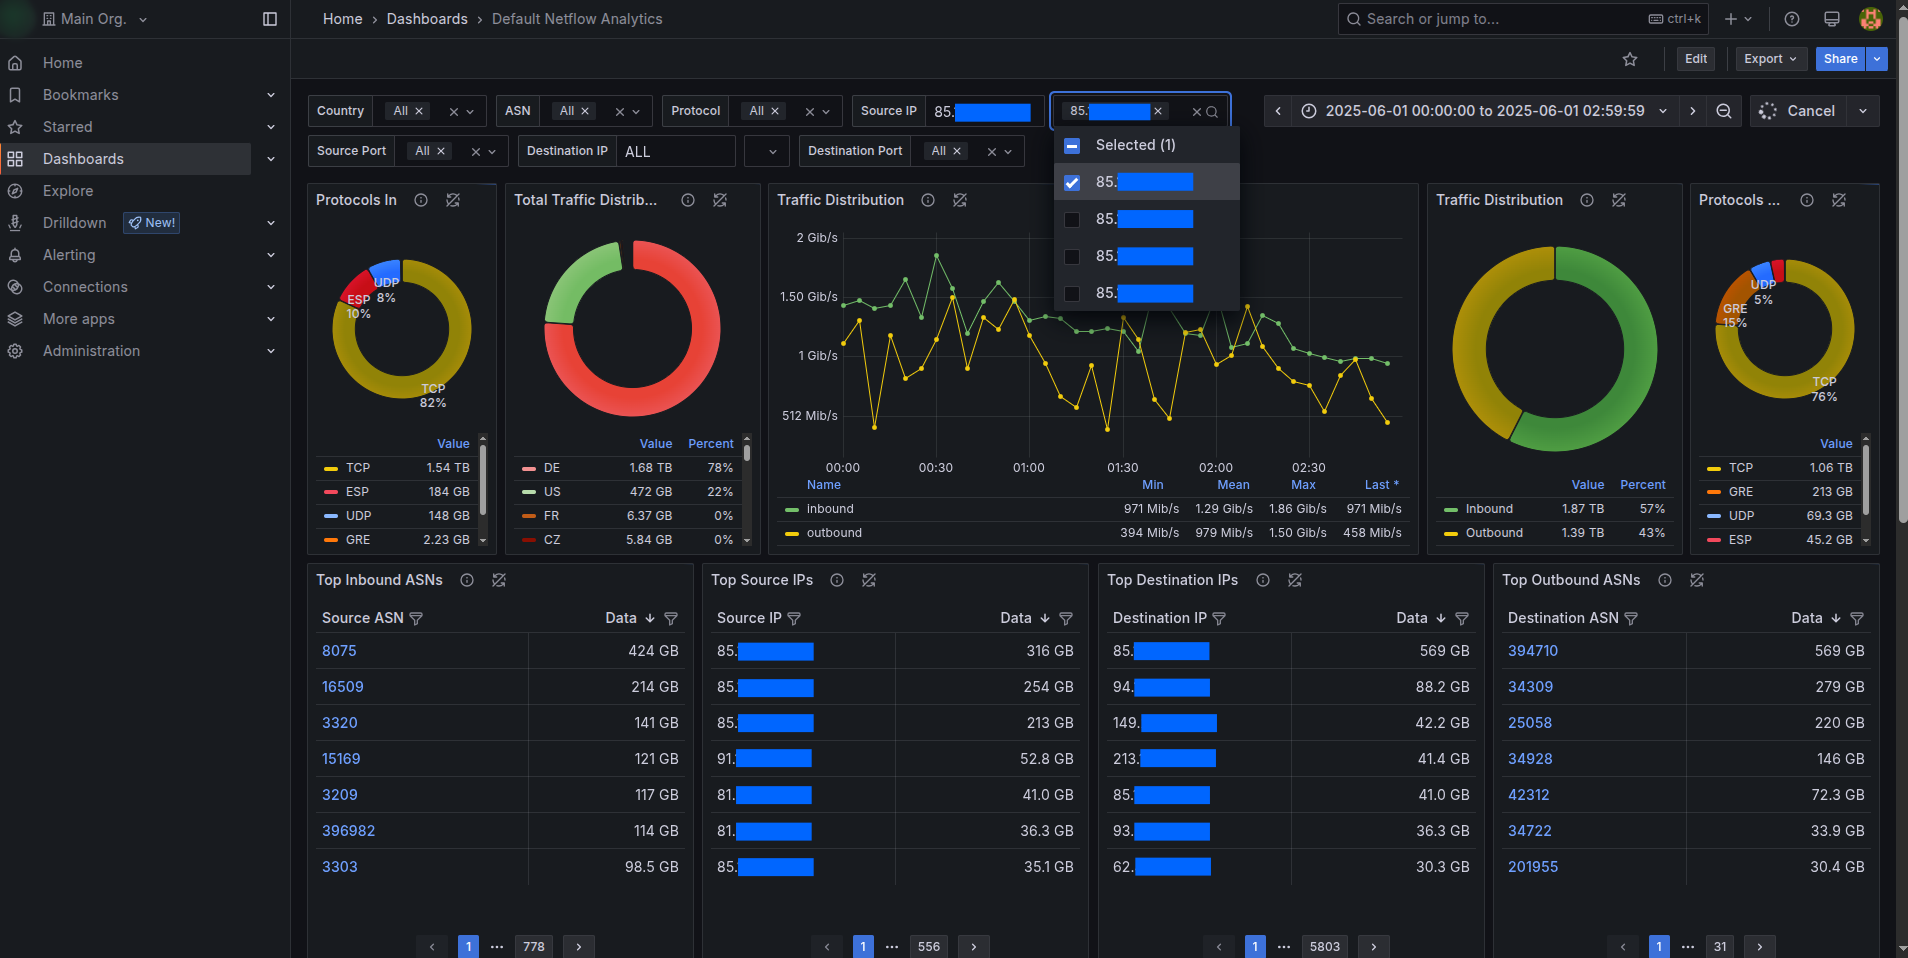
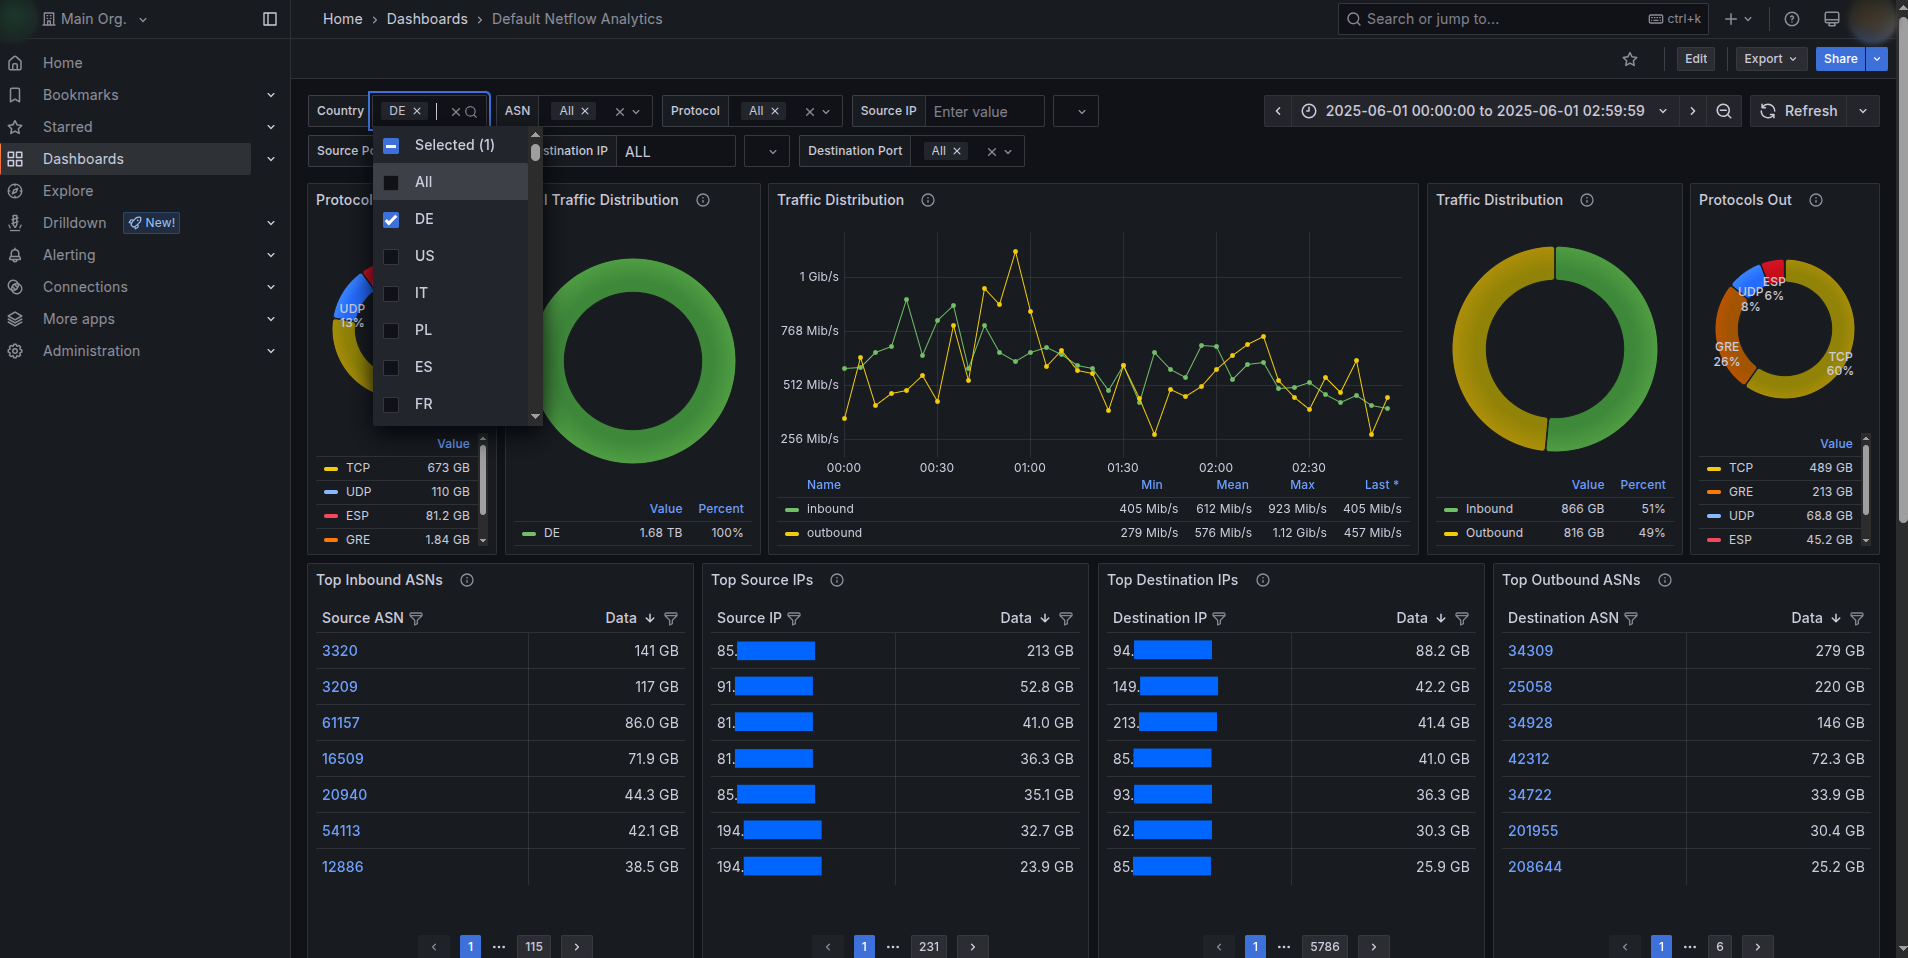
- Prebuilt dashboards: A standard “NetFlow Analytics” dashboard was deployed, featuring:
- Protocol distribution (inbound/outbound)
- Traffic breakdown by country and over time
- Top source and destination IPs & ASNs
- Connection trends
- Powerful filters: Dashboards included global filters (e.g., country, ASN, protocols) with human-readable labels.
- Explore mode: Allowed advanced ad-hoc queries, still restricted by database-level access controls.
- Self-managed alerting: Each tenant could customize and activate their own alerts for thresholds like bandwidth, unique destination counts, etc.
For Client Administrators
- Full access across all organizations to support customers and maintain the quality of service.
- One-click scripts to:
- Provision new tenant environments.
- Update dashboards across the fleet.
- Manage alert templates and configurations.
Technology Highlights
| Component | Description |
|---|---|
| Visualization Layer | Grafana OSS, custom-branded |
| Data Warehouse | ClickHouse with row-level security policies |
| Automation | Python 3.7+ CLI tools using requests & API |
| Hosting | Client-managed infrastructure (VM/bare metal) |
| Security | TLS, strict user-based ClickHouse ACLs |
| Alerts | Grafana API-based, Email notifications |
Documentation & Handover
To ensure the client’s operations team could sustain and scale the platform:
- A SysAdmin Manual was delivered detailing how to provision new organizations, manage users, assign database table permissions, and maintain dashboards.
- A Tenant User Guide was provided to help customers navigate dashboards, set up custom alerts, manage credentials, and use Explore safely.
All tools, scripts, and guides were designed to be fully maintainable and extensible for future requirements.
Outcomes & Benefits
✅ Data Isolation: Each tenant saw only their authorized traffic data, enforced at the database layer.
✅ Operational Efficiency: New tenant environments could be spun up in minutes.
✅ Consistent User Experience: Dashboards and Explore features looked and behaved identically across all tenants, with updates managed centrally.
✅ Custom Branding: The client’s brand was consistently presented across all dashboards, reinforcing trust.
✅ Future-Proof: Tools ensured that even after Grafana upgrades, branding and environment consistency were instantly restorable.
Conclusion
This project demonstrated how combining Grafana’s multi-organization architecture with ClickHouse’s powerful access policies, all wrapped in automated provisioning and branding, can deliver a secure, scalable, multi-tenant analytics platform.
Confidential Notice
This document is intended solely for internal or portfolio use to demonstrate technical capabilities. Specific client details, business metrics, or proprietary configurations have been withheld or anonymized to maintain strict confidentiality.
Technical Appendix
This appendix provides a consolidated look at the core technical assets delivered in the project. It’s anonymized, but maintains all the details needed to showcase the engineering approach.
Automation Components
1. Organization Setup & Provisioning
A Python-based CLI tool (main.py) was built to automate:
- Creation of a new Grafana organization.
- Provisioning of a ClickHouse datasource scoped to the org.
- Creation of an admin user (credentials matching ClickHouse).
- Cloning of a dashboard template from the main organization.
- Cloning of alert templates into a dedicated alert folder tied to the org’s datasource & contact point.
- Setting up email-based alert notifications.
Example CLI call:
python main.py \ --company-name "AcmeCorp" \ --company-email "[email protected]" \ --company-admin-username "acme_admin" \ --datasource-username "ch_user_acme" \ --datasource-password "secure_pass" \ --template-dashboard-uid "dashboardUID123" \ --alerts-folder-uid "alertFolderUID456"🚀 Highlights
- Generates secure, random passwords for Grafana admin users.
- Ensures unique usernames and datasource names (fails cleanly if conflicts exist).
- Sets the cloned dashboard as the home dashboard for the org.
- Newly cloned alerts are snoozed by default to avoid noisy notifications.
2. Dashboard Fleet Maintenance
A companion script (update_org_dashboard.py) allows administrators to mass-deploy updated dashboards to multiple organizations, ensuring visual and analytical consistency.
Example CLI calls:
# Update dashboards across org IDs python update_org_dashboard.py \ --template-dashboard-uid "newDashboardUID" \ --destination-dashboard-name "Default Dashboard" \ --org-ids 2 3 4 # Or target by organization names python update_org_dashboard.py \ --template-dashboard-uid "newDashboardUID" \ --destination-dashboard-name "Default Dashboard" \ --org-names "AcmeCorp" "NetFlowX"🧠 Behavior Notes
- If a dashboard by the same name exists, it’s overwritten.
- If it doesn’t exist, it’s created from the template.
- Only organizations beyond the main (ID=1) are targeted by default.
3. Branding Patch Utility
Because the open-source Grafana does not support white-labeling natively, a Python script (set_branding.py) was delivered to:
- Patch static HTML, TSX, and versioned JS build files to replace titles, footers, and logos.
- Overwrite default Grafana icons with custom-branded assets.
Example CLI call:
python set_branding.py --grafana-version v12Optional dry-run for validation:
python set_branding.py --grafana-version v12 --dry-runConfiguration Highlights
- YAML config files specify regex search & replace patterns for dynamic build files, as well as exact file replacements for static assets.
- Safeguards prevent accidental over-patching by matching specific phrases or files.
🔧 Environment & Security Details
| Component | Detail |
|---|---|
| Languages & Libs | Python 3.7+, requests, pyyaml |
| Grafana Security | TLS enabled, datasource creds tied to row/column policies |
| ClickHouse Access | Row & column policies enforce strict tenant data boundaries |
| Password Management | Randomly generated, printed once to stdout on org creation |
| Grafana Explore | Enabled, but governed by ClickHouse permissions |
Typical Provisioning Flow
| Step | Action |
|---|---|
| 1 | SysAdmin obtains ClickHouse credentials scoped to tenant tables |
| 2 | Runs main.py with tenant details & dashboard/alert UIDs |
| 3 | Script provisions organization, datasource, and admin user |
| 4 | The default dashboard was cloned and tied to the datasource |
| 5 | Alerts cloned into a tenant-specific folder, tied to a new contact point |
| 6 | Branding patches are re-applied after each Grafana upgrade |
Quick How-To: Finding UIDs in Grafana
- Dashboard UID:
Open dashboard → click Share → copy URL → UID is the code after/d/latexhttps://your-grafana.com/d/abcd1234/netflow - Alert Folder UID:
Navigate to Alerting → Alert Rules, inspect network/API payloads in browser dev tools forfolderUID.
Results Recap
✅ Provisioned dozens of isolated tenant environments in minutes.
✅ Achieved full ClickHouse-driven data isolation, dashboards, and ad-hoc queries alike.
✅ Enabled instant dashboard rollouts & updates across tenants.
✅ Ensured brand consistency even after upgrades with a one-command patch tool.
Confidential Note
This appendix reflects the technical implementation from a confidential engagement. It is anonymized and provided solely to demonstrate engineering approach, automation strategies, and architectural practices.
Contact us for more details on this case.


